
1. At the top of the "Dashboard" page, you can see two tabs: "Analytics" and "Analytics v1.0". 2. Click "Analytics" to switch to another analysis view; click "Analytics v1.0" to return to the current default analysis page. 3. To adjust display settings, click the "⚙️" icon in the top right to open the settings options. 4. If you encounter issues during operation, click the floating "🎧" customer service button in the bottom right to contact support.
💡 Tip: The two tabs may present different data content. We recommend choosing the view that suits your actual needs.
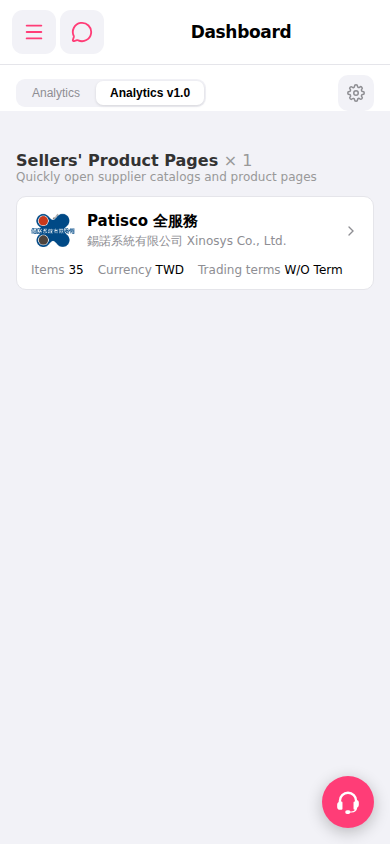 手機版|Dashboard